Web Viewer
AIS-catcher includes a simple web interface. A live demo is available for East Boston, US. The web interface gratefully uses the following libraries: chart.js, chart.js annotation plugin, leaflet, Material Design Icons, tabulator, marked and flag-icons.
Make sure you use the latest version and start the web viewer as follows:
AIS-catcher -N 8100
8100 is the port number. If your machine network name is raspberrypi, e.g., then enter raspberrypi:8100 in your browser. On the web page, you will find several sections with information related to the station and received messages.
For users wishing to include a station name and a link to an external website in the Statistics section:
AIS-catcher -N station Southwood station_link http://example.com
AIS-catcher -N lat 50 lon 3.141592 share_loc on
share_loc (default is off) will allow the web viewer to access and display the location.
The user can make a page in markdown format. The content will be shown in the About tab of the web viewer:
AIS-catcher -N 8100 about about.md
server), see below.
Menu structure
The main menu behind the hamburger icon in the top left corner navigates between different functional areas. Context-sensitive menus, accessible through right-click, long press on iOS, or the vertical dot icon on the map, offer more functionalities. Here you can set options like activating the "dark mode" theme, displaying the station range on the map, locking/unlocking the map center, toggling text-only ship labels, decluttering ship labels, and viewing details of the last message received from a vessel, amongst others.
Visualization
When AIS-catcher receives data containing a vessel's dimensions but can not determine the direction it is pointing (heading), it will display a circle that accommodates the ship's dimensions regardless of heading. Missing heading information is common for Class B ships. If there's a decent approximation available for the heading, such as course-over-ground above certain speeds, it will be used. Shapes plotted using this approximation will have a dashed border, indicating incomplete information. An example is the USS Constitution docked in Boston.

In the map section, clicking on a vessel will open a ship card with details of the vessel. For smaller screens it can be minimized in the top bar (via the ^ symbol or by clicking on the header bar). The ship card will open minimized on mobile devices. In its maximized form, users can choose which rows will be visible in the minimized state. Additional options, such as looking up the vessel on aggregator sites, are available by clicking the three-dot icon on the ship card header.
Ship card fields
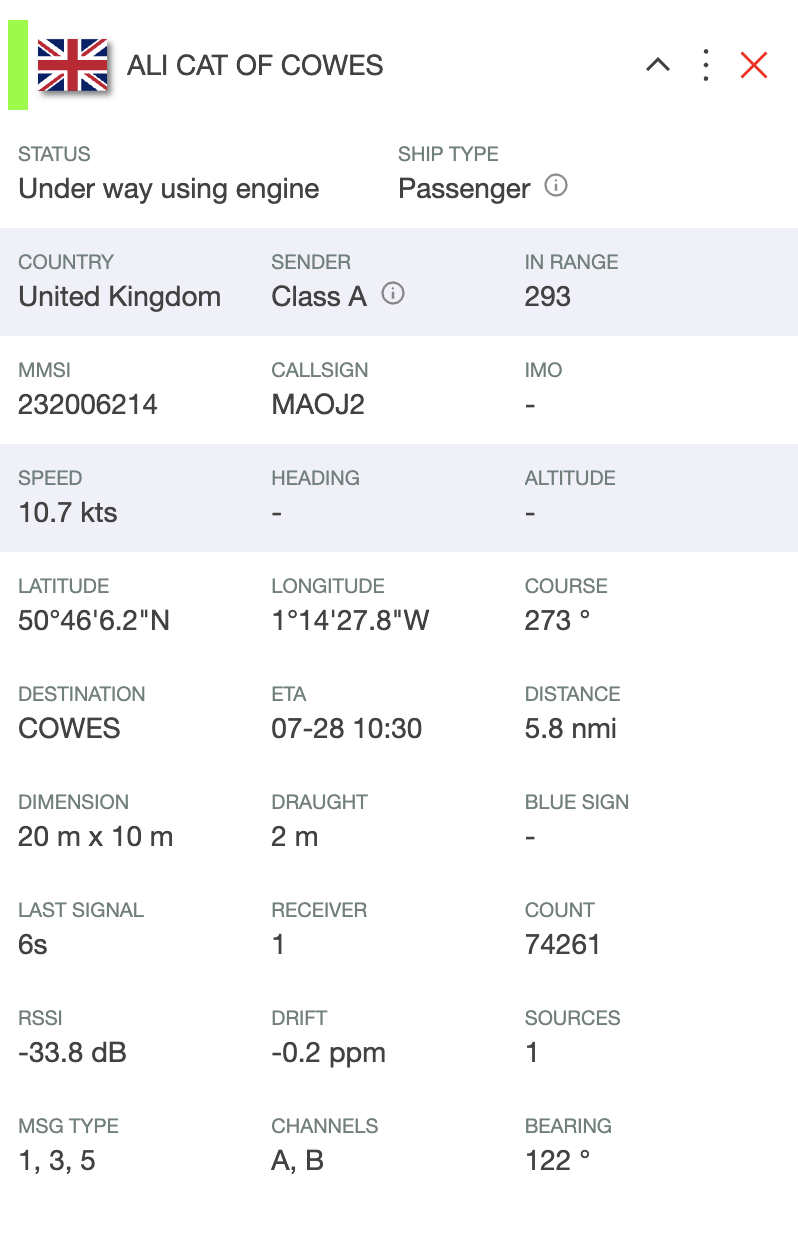
Most fields on the ship card are self-explanatory and come directly from the vessel's AIS messages. The less obvious ones:
| Field | Meaning |
|---|---|
| In Range | Number of other AIS stations the vessel's own transponder reports it is currently receiving (from the SOTDMA communication state, ITU-R M.1371). It describes the radio situation around the ship, not how well your station receives it. Only present in some transmissions, so it can be empty or update irregularly. |
| RSSI | Signal strength (in dB) of the vessel's last message as measured by your receiver. |
| Drift | Estimated frequency offset (ppm) of the last message, useful for calibrating an RTL-SDR dongle. |
| Distance / Bearing | Position of the vessel relative to your station location. |
| Receiver / Sources | The receiver (group) that delivered the most recent message, and all receivers that have contributed messages for this vessel — relevant when running multiple receivers or network inputs. |
| Count / last signal | Number of messages received from this vessel and the time since the most recent one. |
| Sender | Type of transmitter (Class A/B vessel, base station, aid-to-navigation, SAR aircraft, etc.), derived from the MMSI and message types. |
| Destination / ETA | Voyage data as entered by the crew; the ETA is specified in UTC by the AIS standard. |
| Blue Sign | Blue sign status for inland (river) vessels. |
Clicking a row on the maximized ship card selects it as the row that remains visible when the card is minimized/collapsed, so you can pick the information that matters most to you for the compact view.
Validation
The web-interface shows a "validation" indication at the left border of the ship card header.

AIS-catcher analyzes an enormous stream of bits per day for both AIS channels (2 to the power 33 to be precise). To avoid erroneous messages, the AIS system employs a 16-bit CRC and matching of other bit patterns. Unfortunately, purely statistically this cannot prevent that there will be an occasional technically correct but nonsense message. These are typically easy to recognize (e.g. looking at the signal level, and location on the map) and aggregator sites like MarineTraffic will filter these out.
To reliably measure the reception range for the station in the web interface, AIS-catcher has implemented a "validation function" that checks the location of the vessel for consistency between messages and flags if there is an inconsistency. Practically speaking, if we receive a position from an MMSI that is relatively close to the last received position, the "validation" indicator will be green and the distance to the station will be included to determine the station range. Please note that messages within 50 NMi from the receiving station will always be included for range setting. The validation indicator will be grey if validation for the location cannot be performed and red if it is not successful.
Plots
The Plot section contains several visualizations to assess the performance of the receiver:

Restarting AIS-catcher typically erases history in the graphs. To retain plot "state" and backup the information to a file use the following:
AIS-catcher -N 8100 file stat.bin backup 10
stat.bin. The minimum backup interval is 5 minutes.
Custom plugins and styles...
To give the user the option to tweak the look-and-feel and functionality of the web viewer and/or modify for example the color scheme or regional preferences, the program provides the option to inject custom plugins (JavaScript) and CSS into the website, with a command like:
AIS-catcher -N 8100 plugin plugin1.js plugin plugin2.js style mystyle.css
AIS-catcher -N 8100 plugin_dir /usr/share/aiscatcher/plugins
.pjs and .pss for respectively JavaScript and CSS style plugins. The repository includes a few example plugins that demonstrate how to add additional maps or cater to regional preferences. Examples of plugins can be found in another GitHub repository.
Offline web viewer
The web viewer runs without an internet connection out of the box: all web libraries are now bundled into AIS-catcher, so no online content is fetched to render the interface. This facilitates using the web interface whilst traveling.
Offline maps can be included in mbtiles format:
AIS-catcher -N 8100 mbtiles filename
AIS-catcher -N 8100 mboverlay filename
Sending data to Prometheus for use in Grafana dashboards
You can add the option PROME on to the web configuration command to start rendering Prometheus-compatible statistics at /metrics. For example:
AIS-catcher -N 8100 prome on
For more information on how to configure Prometheus and Grafana to get an initial dashboard, see README-grafana.md.
Multiple receivers in one viewer
When a viewer receives from more than one receiver, it keeps a combined view called All plus a separate view per receiver, and a Select Receiver button appears in the header to switch between them.
Set split off to keep only the combined view:
AIS-catcher -N 8100 split off
The per-receiver views are then never created. The Select Receiver button disappears, and requests such as /api/stat.json?receiver=2 return the combined data. This is useful for a public viewer where visitors should see the overall picture rather than the individual receivers, and it also lowers memory use, since each per-receiver view keeps its own vessel database and track history.
To restrict a viewer to a subset of receivers instead of combining all of them, use zone or groups_in. A viewer that ends up with a single receiver has no Select Receiver button either.
Cross-origin access (CORS)
The data endpoints intended for external consumers send an Access-Control-Allow-Origin: * header so that browser-based dashboards and other web pages can fetch them directly without a proxy. The HTML pages and other resources served by the web viewer are deliberately not CORS-exposed.
CORS is enabled on:
/api/ships.json,/ships.json,/api/ships_full.json,/api/ships_array.json/api/planes_array.json/api/binmsgs.json/api/history_full.json/api/stat.json,/stat.json/api/path.json,/api/allpath.json,/api/path.geojson,/api/allpath.geojson/api/message,/api/vessel(per-vessel last message and details)/api/decode(whendecoderis enabled)/kml/metrics(Prometheus)
The Content-Security-Policy served by the web viewer also accepts http/ws schemes in img-src and connect-src so LAN deployments work without a custom policy.
Summary Settings
Server Options:
| Setting (JSON key / CLI setting name) | Type | Default | Description |
|---|---|---|---|
| port | integer | - | Single port for web server |
| port_min | integer | - | Minimum port in binding range |
| port_max | integer | - | Maximum port in binding range |
| ip_bind | string | - | Server binding IP address |
| reuse_port | boolean | false | Enable SO_REUSEPORT on the listening socket |
| zlib | boolean | true | Enable response compression |
| server_mode | boolean | false | Enable hardened multi-station server mode |
| log | boolean | false | Show the log view in the web viewer |
| frame_ancestors | string | - | CSP frame-ancestors value; set to allow embedding the viewer in an <iframe> |
| groups_in | integer | all | Bitmask of input groups feeding the viewer |
| zone | string | - | Comma-separated zone tags routed to this viewer |
| split | boolean | true | Track each receiver separately next to the combined view; set to off for a combined view only |
| Location Settings | |||
| lat | float | - | Station latitude |
| lon | float | - | Station longitude |
| share_loc | boolean | false | Share station location |
| use_gps | boolean | true | Use GPS data for station location |
| own_mmsi | integer | - | Own vessel MMSI |
| Data Management | |||
| history | integer | - | History retention (5-43200 sec) |
| cutoff | integer | - | Max Distance threshold (0-10000) |
| backup | integer | -1 | Backup interval (5-2880 min) |
| file | string | - | Statistics file path |
| stats_on_close | boolean | false | Write/print statistics when the server shuts down |
| realtime | boolean | false | Enable real-time updates |
| decoder | boolean | false | Enable online NMEA decoder |
| Output Formats | |||
| kml | boolean | false | Enable KML output |
| geojson | boolean | false | Enable GeoJSON output |
| prome | boolean | false | Enable Prometheus metrics |
| UI Customization | |||
| message (alias msg) | boolean | false | Store the latest decoded message per vessel, viewable via the Show Last Message item in the vessel's right-click menu |
| station | string | - | Station display name |
| station_link | string | - | Station info URL |
| webcontrol_http | string | - | URL for external web control endpoint |
| context | string | settings | Default web viewer context/tab |
| mbtiles | string | - | Offline map in mbtiles format |
| mboverlay | string | - | Offline overlay in mbtiles format |
| fstiles | string | - | Offline map from filesystem tile directory |
| fsoverlay | string | - | Offline overlay from filesystem tile directory |
| plugin | string | - | JavaScript plugin path |
| style | string | - | CSS style path |
| plugin_dir | string | - | Plugins directory |
| about | string | - | About page path |
In addition to the options above, the web viewer accepts the standard message-filtering settings (e.g. FILTER on, allow/block by message type or channel). These restrict which messages reach this particular viewer.